Abstract
Engineering structures are generally understood to be predominantly functional objects, such as bridges, tunnels, cranes, silos etc. Failure of these structures not only causes physical damage but can also lead to interruption of production, disturbance of infrastructure or traffic and thus disruption of operations with commercial impact for both the asset owner as well as concerned commuters or customers.
Therefore, in-situ monitoring is of major importance. The challenge lies in the need to observe specific parameters in difficult to access locations, under demanding environments, or with high data rate requirements. These conditions often exceed the capabilities of geodetic observation techniques. Wireless Condition Monitoring (WCM) nowadays can breach the gap by implementing a variety of sensors and maintenance-free hardware without the requirements of line-of-sight or cables. Compact Nodes with internal and external sensors and low power consumption are versatile and provide long battery life. Remote access allows adjustment or temporary changes of configuration settings (e.g. recording intervals). Automated data transfer to cloud-based visualization platforms enables continuous data access with configurable alerts, allowing for proactive evaluation of structural health.
The article presents a number of practical field examples that address the challenges mentioned above, while highlighting the specific requirements for interpreting the collected data – supported by examples of result validation using independent techniques.
1 Monitoring of Engineering Structures
Motivation
Per definition, the primary focus of engineering structures lies in fulfilling functional tasks. According to DIN 1076, engineering structures include relevant buildings, transportation systems, bridges, tunnels, trough and retaining structures, but also silos, masts, chimneys, cooling towers, industrial facilities, etc. If a structure can no longer fulfill its function, the damage is not limited to the structure itself but also includes the loss of its economic utility. In industrial plants, entire production lines can be affected if a single component fails. Naturally, structural safety is of fundamental importance and ensuring usability while avoiding failure-oriented maintenance is essential.
As an additional challenge, monitoring usually has to be conducted during full operation, which causes limited accessibility and demands an extraordinary robustness of the hardware.
Automation of Monitoring
Monitoring of engineering structures typically focuses on relatively small-scale structures. The motivation to automate monitoring usually stems from one or more of the following:
- The required sampling rate makes manual monitoring impractical or inefficient.
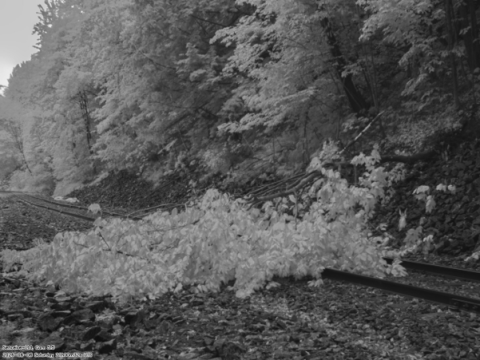
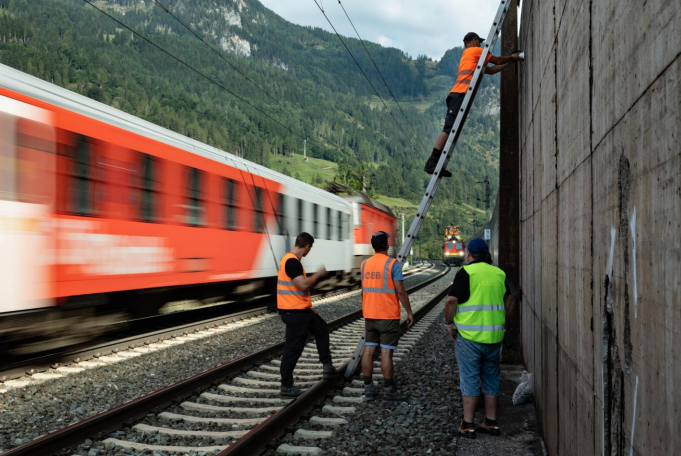
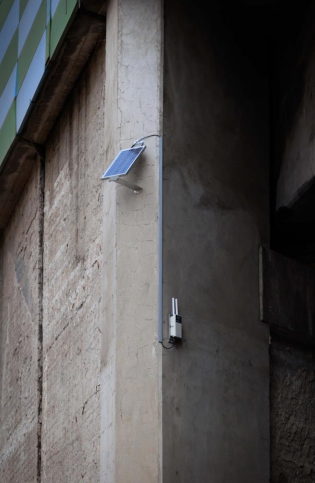
- Access to the monitored object is generally difficult, uneconomical, or dangerous (see Figure 1).
- The observation period is very long. Automation ensures that operations (e.g., traffic flow) remain undisturbed. Moreover, smart automation of the monitoring process allows operational workflows (e.g. traffic flow) to remain undisturbed.
Monitoring, as a broad term can involve various parameters, including economic or statistical indicators characterizing industrial usage. It may also be necessary to record internal and external timeframes to synchronize operational influences with structural integrity parameters.
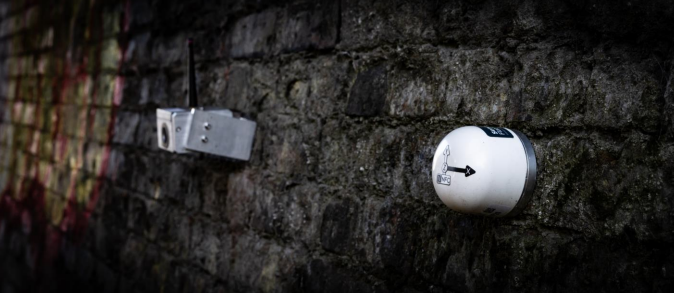
Figure 2: Wireless Sensor Nodes: 3-Axes-Tilt-Sensor (Triaxial Tilt Sensor) (Foreground) and Laser Distance Sensor (Background)
Figure 3: Solar powered cellular gateway, intermediately stores the sensor data and transmits it to the server
Automated systems collect data in regular or event-triggered intervals and transmit it to a platform, locally or via cloud-based interfaces accessible through a web browser.
2 Wireless Monitoring Systems
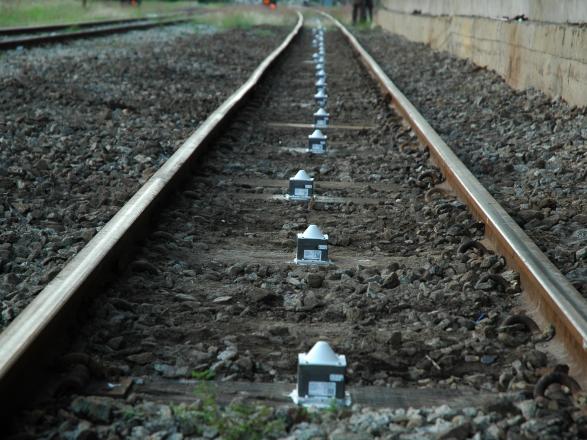
Various observation methods can be considered wireless (e.g., prisms, remote sensing). Generally, the term refers to what has become known as Wireless Condition Monitoring (WCM): active sensors with autonomous data acquisition units, or ‘nodes’, that integrate sensing, power supply, and data transmission. These nodes can incorporate external sensors with various signal types (analog or digital) and are highly compact. Miniaturized low-power MEMS (Micro-Electro-Mechanical Sensors) have opened the door to practical usage. For instance, tilt sensors consist of a chip-based nano-sized probe resting between capacity electrodes recognizing gravity related rotations. Available High-G versions offer considerable resistance to physical shock. Additionally, built-in mechanical as well as statistical filters help eliminate outliers. Some manufacturers include additional accelerometers that allow sensor values to be triggered by outside impacts which occasionally is utilized in slope and embankment monitoring as well as rockfall detection.
In Figure 2 examples for commercial 3-axis tilt sensors, and laser distance sensors, are shown, offering more than 10 years of battery life at half-hourly data sampling rate.
Communication and Operation
Data is typically encrypted and transmitted from nodes to a local gateway (Figure 3), and from there via cellular networks to an online platform. Internally, systems use 2.4 GHz Wi-Fi frequency for high bandwidth or LoRa for long range (868 MHz licensed in Europe). Due to short sampling intervals and small monitoring areas in structural applications, 2.4GHz is often preferred. LoRa only allows longer reporting intervals and has limited two-way communication, making remote configuration more difficult. 2.4GHz-based systems mitigate shorter range via node meshing, where neighboring nodes act as repeaters. Gateways can be solar powered, enabling flexible placement. Unlike geodetic methods, WCM does not require line-of-sight, allowing sensor placement on hard-to-reach structures. Sensors are maintenance-free and configurable remotely.
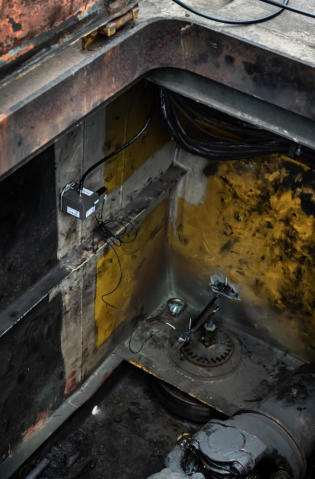
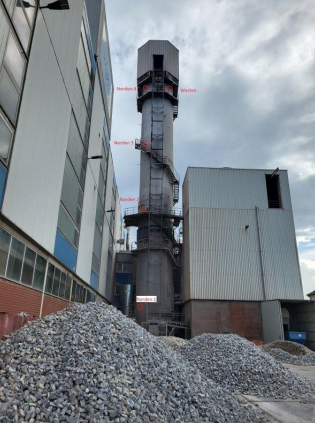
Figure 4: Sensor locations at the Südzucker Lime Kiln in Wabern/Germany
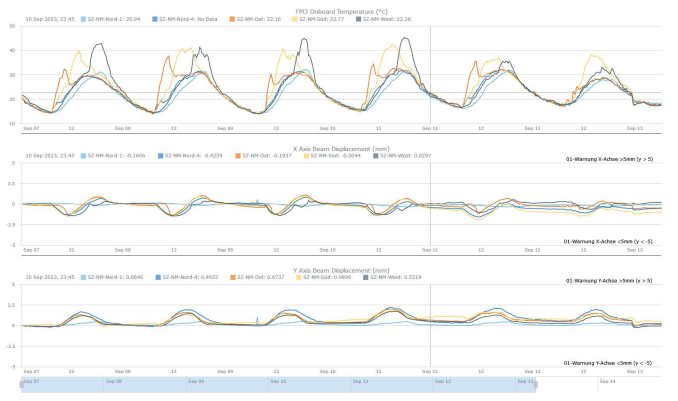
Figure 5: Correlation of Lime Kiln Deformation with diurnal Sun Exposure (Tilt Units in mm/m)
Applications and Interpretation
Interpreting WCM results can be challenging. While geodetic methods like Total Station observations provide 3D coordinates, tilt sensors only provide angular data, which must be interpreted cautiously. For instance, when converting angular units via trigonometric calculations, i.e. projection onto real respectively virtual beam lengths, into more intuitive metric values, (e.g. mm/m) structural stiffness and deformation behavior must be considered.
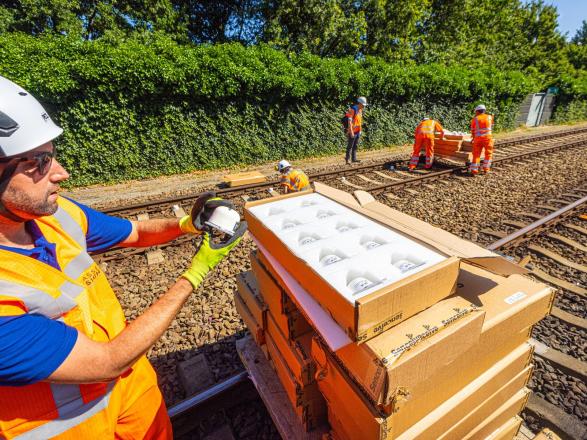
Sometimes, the mere indication of movement is enough to trigger further action. In inaccessible areas like rail zones, ease of installation and maintenance are crucial (see Figure 1). If models of deformation characteristics exist, tilt angles can be extrapolated to derive horizontal or vertical displacements of masts, walls, foundations, etc.
3 Case Studies
Südzucker Lime Kiln, Wabern
3.1.1 Situation
The lime kiln at the Südzucker site in Wabern/Germany was monitored to assess its behavior during operation, including firing and loading phases. The structure is a 48.5m tall cylindrical tower with a diameter of 2.66m. Tilt sensors were mounted in all four cardinal directions near the top of the tower. As mentioned above, extrapolating tilt measurements along the length of a structure requires the assumption that the structure is rigid. If the assumption holds, the recorded tilt values can be projected over the kiln’s height to measure the horizontal displacement at the top of the structure. Model assumptions like this naturally must be validated.
As it was rather unlikely that the tower would tilt as a rigid body over the entire almost 50m, three additional sensors were installed in a vertical alignment on the north side from the foundation to the top (Figure 4).
Typically, MEMS tilt sensors provide resolution of approximately 0.0001° or less than 0.002 mm/m with repeatability of roughly ±0.0005° (less than ±0.01 mm/m). Critical though is temperature correlated sensor behavior which can reach a magnitude of 0.0017°/K (0.03mm/m je °K) [1]. Therefore, to achieve higher accuracy, temperature compensation is required, or the installation must be configured to separate deformation effects from temperature influences.
3.1.2 Interpretation
The installation took place in early September, at a time when temperatures fluctuated between approximately 15°C at night and, in some cases with strong sunlight, well over 40°C during the day. Since all nodes are equipped with an internal thermistor, the local temperatures were recorded directly at the sensor.
Figure 5 depicts the nodes’ behavior for all four top nodes and the bottom one on the north side. The top graph shows the nodes’ temperature recordings for roughly the first week of observations. Temperature peaks shifting from east to west throughout the duration of one day reflect the sun’s path. Naturally, no temperature peaks occurred on the north side; however, the bottom and top sensor in the North i.e. the light and dark blue graphs still followed the general daily temperature pattern.
When examining the movements in the horizontal X and Y directions (Figure 5 lower two graphs in mm/m), a temperature-correlated, oscillating motion pattern can be observed in all sensors located in the upper tower area. In contrast, the tilt sensor at the base of the tower showed virtually no movement. These observations essentially allow two conclusions to be drawn:
a) The movement in the upper part of the tower is real and not caused by temperature effects on the sensor, as otherwise the sensor at the base would also show temperature-correlated movements.
b) The tower deforms increasingly with height and does not tilt as a rigid body.
Therefore, the above demanded separation of temperature impact from the real signal could be achieved by appropriate sensor constellation. The derivation of realistic horizontal displacements at the various levels of the kiln would require more sophisticated differential models not conducted during this task (for comparison see 3.4).
Crane Track at Thyssen Krupp, Duisburg
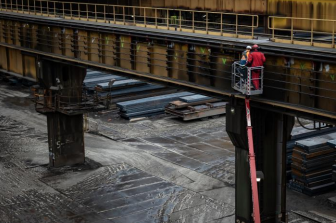
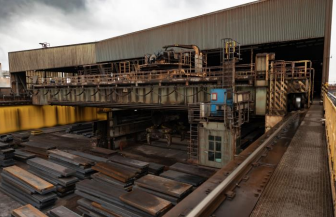
Figure 6: Installation of tilt sensors on the supports and longitudinal beams of the crane rails
Figure 7: Crack sensor for detecting the internal deformation of the crane bridge
Figure 8: Mobile crane bridge with centrally positioned gateway
3.2.1 Task and Realization
According to the client, German Thyssen Steel Company in Duisburg/Germany, the crane track girders had previously exhibited wear damage with unknown causes in the past. It is suspected that crane movements while transporting heavy steel slabs induce short-term deformations, which remain detectable by geodetic methods among others due to their dynamic nature.
3.2.2 Data Considerations
Tilt sensors and crack sensors were installed on supports and beams (Figure 6 and Figure 7), with their positions measured geodetically.
Additional gateways were placed on each crane bridge to allow for independent, stable, yet mobile wireless mesh networks (Figure 8). Data was sampled every 2 seconds and transmitted via cellular network. Through an API-based database interface, approximately 400 MB of CSV data per day was transferred over several months to a local computer.
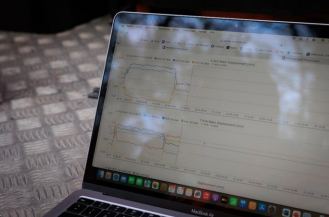
Moreover, the timestamp of the data allows synchronization between sensor behavior and crane position. This should enable the user to associate specific load cases and crane configurations with the corresponding sensor.
At the time of writing, the geometric evaluation of the combined data from sensor readings and crane positioning is still ongoing and will be the subject of a student master’s thesis.
Even ahead of that outcome, the project has already demonstrated that such high sampling rates can be handled wirelessly over extended periods of time.
Figure 9: Permanent Observation of Abutment Tilt and indicative vertical Displacement of the Bridge Deck
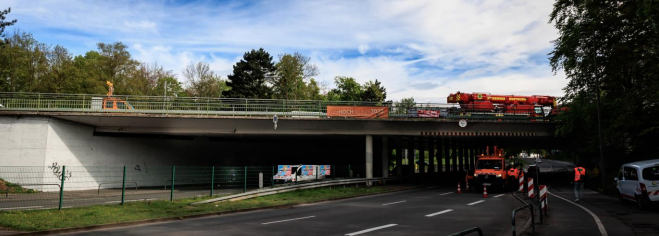
Figure 10: Bridge during load test with 48t mobile crane
Indicative Monitoring Bridge BAB43 Bochum
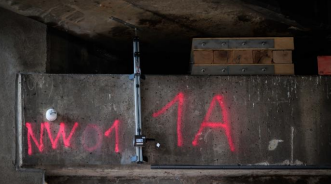
At a highway bridge in Bochum/Germany the asset owner expressed concerns that the cylindrical roller bearing might exceed its margins due to the abutment tilting outwards. In order to avoid dangerous vertical displacement (“drop”) of the bridge deck, wooden supports were inserted that would only allow <10mm sag.
Since the question of whether the vertical displacement occurred was essentially binary – either it happened or did not – a low cost, indicative alarm solution was requested to run alongside the abutment tilt observations. A spring-loaded telescopic crack sensor was installed (Figure 9) that allowed for diurnal and seasonal horizontal movement of the deck while reliably indicating vertical displacement.
Bridge on Wittekindstraße, Dortmund
3.4.1 Situation and Task
Compared to the above, this Dortmund bridge demanded more detailed i.e. quantitative observation. The case presented involves a slab structure built in 1957, consisting of two identical superstructures separated by a joint, each approximately 31 meters in length, with four individual bridge spans of about 15 meters each (Figure 10). At this location, two major traffic arteries of Dortmund intersect in an urban setting: the six-lane B1 and the four-lane Wittekindstraße.
An expert report prepared in 2023 confirmed the load-bearing capacity of the bridge. To ensure continued safe operation, permanent monitoring was recommended as a supplementary measure to the regular structural inspections. As a result, the Civil Engineering Department of the City of Dortmund, in collaboration with the Surveying and Cadastral Office, developed a monitoring concept that included the continuous observation of the structure using WCM sensors.
Following the layout of the prestressing tendons, tilt and strain sensors were installed across the four bridge spans (Figure 11). The arrangement was designed to approximate the expected deformation trough using four tilt sensors per bridge deck, i.e. two tilt sensors at each shoulder and a strain sensor in the middle, where the greatest tensile stress was expected. In addition, transverse cracks were equipped with potentiometric crack sensors, and temperature probes were embedded in the concrete. The system was installed using a lifting platform within a single day and has been transmitting data to a browser-accessible cloud server at 30-minute intervals since October 2023.
Figure 11: Arrangement of the WCM sensors (tilt, strain, and crack sensors) and operation of the laser scanner during the load test
Figure 12: Visualization of the deformation during the load test via live access to the cloud portal
3.4.2 Load Test
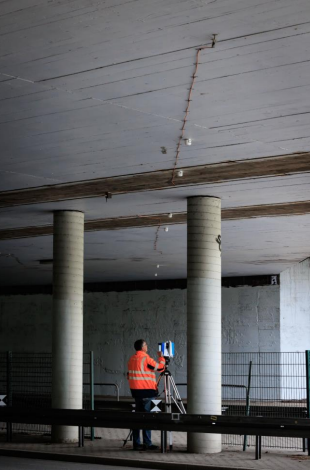
The initial expert report had already recommended a dedicated load test, which was carried out in April 2024 using a 48-ton crane provided by the Dortmund fire department (Figure 10).
Specific loading points were defined by the Civil Engineering Department and marked by the Surveying and Cadastral Department1. For the test, the sensor system was remotely switched into a 30sec interval live mode. This was intended to ensure that the vehicle remained in position until the increase in deformation had subsided and stabilized at a constant level. It turned out that the full deformation occurred almost instantaneously (Figure 12). Accordingly, the crane was held in position for approximately 15 minutes before moving to the next position. This duration allowed precise evaluation of the sag dynamics while providing redundant observations to generate reliable, representative averages in order to avoid data noise bias.
(Graphic: [2] M.Różański)
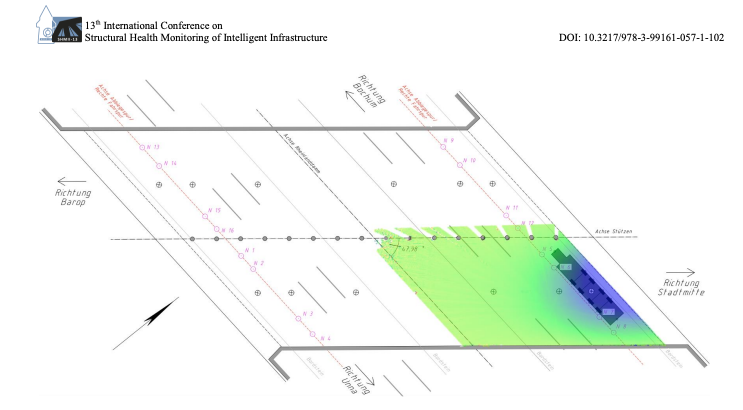
To compare the two methods, a cross-sectional profile-spline was calculated through the scan-generated surface, following the layout of the prestressing tendons.
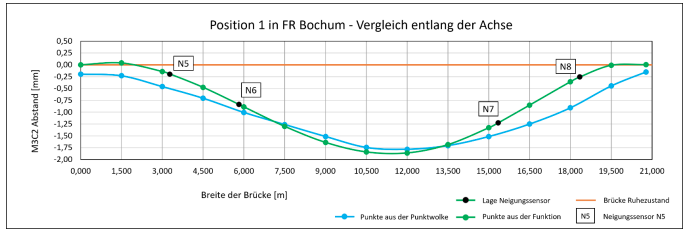
In order to get a comparable graph from the tilt nodes the resulting deformation trough was approximated by a higher order polynomial with the tilt values representing tangents at dedicated “chainage”. The tangent gradient is obtained from the first derivative of the polynomial. Accordingly, the inclination values can be used to solve the system of differential equations and determine the coefficients of the polynomial. In this way, a deformation profile can be calculated from the inclination values. Thanks to the high data density – through the large number of surface-representing points in the Laserscan and the repeated measurements from the tilt sensors – both systems achieved sub-millimeter relative accuracy at the collocation points.
Figure 13: Example visualization of the load-induced deformation pattern of a bridge span from the surface scan (Graphic: [2] M.Różański)
Figure 14: Comparison of the results from surface scanning and tilt sensor data along the course of the prestressing tendons (Graphic: [2] M.Różański)
The resulting graphs are shown in Figure 13. Since a laser scanner profile includes significantly more sample points, local deformations that fall between the gaps of the WCM are only picked up by the scans. Nevertheless, both methods yield similar results, coinciding closely in shape and differing by approximately 0.2mm.
The observed result came reassuring to the local authority. Not only did the results confirm that the installed system provides correct and representative data. The observed deformation of around 2 mm, confirmed the prediction and as such do not indicate any cause for concern regarding the structural integrity of the bridge.
The results of both measurement methods aligned within the submillimeter range. This demonstrates that the automated system is well suited for capturing the deformation behavior in a representative manner. Continuous monitoring can therefore be entrusted to an automated system, which can then trigger more detailed laser scanning if warning thresholds are exceeded.
(Graphic: [2] M.Różański)
4 Conclusion
Using several practical examples, the capabilities of Wireless Condition Monitoring (WCM) for monitoring complex engineering structures has been demonstrated. While the operation of the system is low-maintenance and the installation is quick and straightforward, interpreting the results requires a certain level of understanding regarding the behavior of the structure.
The versatility of WCM is evident not only in the wide range of sensors available or possible to integrate, but also in the installation possibilities on or within the structure without the need for line-of-sight connections. The sensors operate autonomously, making them suitable for hard-to-reach or inaccessible areas, and their long battery life enables them to be used for long-term monitoring tasks. High sampling rates could be achieved, as well as temporary adjustments via remote access.
It is important to emphasize that WCM should not be seen as a competitor to traditional geodetic methods. Rather, it fills the gap where conventional approaches are impractical or inefficient. For example, WCM enables high-frequency, continuous monitoring and, through automated alerts, trigger manual geodetic verification when needed.
Utilizing WCM sensor technology allows safe extension of the observed structures’ life span while reliably identifying approaching deterioration, without compromising on safety or risking disruptions to increasingly interconnected infrastructure systems.
Acknowledgments
The author’s sincere gratitude goes to all individuals, partners and companies involved who allowed and made it possible to present their projects.
This article was originally published by Senceive, where it appeared as a conference paper for the 13th International Conference on Structural Health Monitoring of Intelligent Infrastructure. It is shared here under a CC BY 4.0 licence.